Harringay, Haringey - So Good they Spelt it Twice!
"The wrong side of the tracks"
Very interesting blog post by the geographer Dr Alasdair Rae (Sheffield Uni) on the 'Income Deprivation Affecting Children Index' (IDACI). He has plotted out the data for every local authority in England.
This is Haringey.
Rae’s blog post says the IDAC is:
proportion of all children aged 0 to 15 living in 'income deprived' families. 'Income deprived' is defined as 'families that either receive Income Support or income-based Jobseekers Allowance or income-based Employment and Support Allowance or Pension Credit (Guarantee) or families not in receipt of these benefits but in receipt of Working Tax Credit or Child Tax Credit with an equivalised income (excluding housing benefit) below 60 per cent of the national median before housing costs
and he adds
“ Just bear in mind that the maps present a relative picture for England as a whole and that, broadly speaking, red = bad and blue = good.”
If I had the data (and time!) I would like to do something to show how many kids rather than proportion and see what that looked like. (I would hope it would take out the odd thing showing up in Finsbury Park).
Our local authority is clearly a game of two halves.
And the line of the train tracks is clear.
Replies to This Discussion
-
Permalink Reply by John McMullan on
-
The railway is like a river. It has very few crossing points for traffic (4!) between Finsbury Park and where it splits above Alexandra Palace station, hence a lot of the ladder's traffic problems, and there are only another four pedestrian crossing points. I'm sure a psychological barrier as much as a physical one too.
-
Permalink Reply by Michael Anderson on
-
It's interesting how the divide between least and most deprived fall roughly into the old boroughs of Hornsey and Tottenham. Despite being amalgamated as Haringey in the 60s not much has changed.
-
Permalink Reply by Mark B on
-
@ Michael - yes - that's basically what crossed my mind. I will have to dick up a population density map of the local authority.
@ John - interesting how poverty and deprivation floods over tracks where it can. Almost like it's downhill :-)
-
-
Well the original idea when Haringey was created and this situation already existed was that the wealth in the west would help support the deprived east which had just lost a lot of its light industrial jobs. Unfortunately the cap on council tax put paid to that.
Having become interested in this mysterious "hard left" beast recently and been to some gatherings to listen to them speak I do understand why the west have been reluctant to share their wealth with the east, it really seems like theft.
-
Permalink Reply by maggie on
-
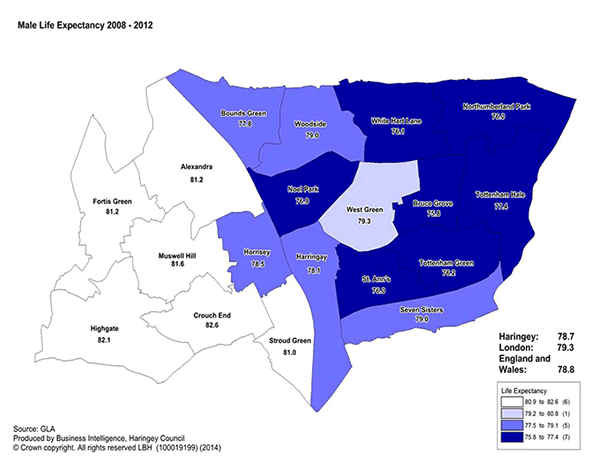
Wrong side of the tracks again! Dark blue= bad. White =enjoying a few extra years out west.
Figure 35. Male life expectancy 2008-12
-
-
Looks like the usual pointless rhetoric from an overpaid academic to justify his existence. I've just pulled out a random piece of writing by the said Dr Rae:
'Abstract Over the past 20 years, world cities research has made a worthy attempt at mapping out the epistemological terra incognita in relation to the interface between contemporary globalization processes and an elite group of economically powerful cities. However, this has resulted in the construction of a theoretical object that seems inadequate when faced with the reality of global economic processes as they relate to less powerful,'ordinary'cities throughout the world. Using relevant examples from the literature and introducing British...'
Obviously a master of psychobabble, as I always say; "bullsh_t baffles brains"
-
-
OK Xavier I get that you are not keen on academic geographers. I dare say that one can pick a "random piece" from anything any of us has done / written to use for ridicule. Apparent accessibility of language always causes me problems. Personally I don't like Jane Austen (I kind of agree with Mark Twain on her writing) - but I am told it's to do with me misunderstanding her.
In the spirit that I posted the graphic, and that Alan Stanton gets:
it's vital that anyone concerned about inequality and poverty in Haringey and elsewhere, has a handle on these figures and what they mean in practice.
Do you have a comment about Rae's plotting of the English Indices of Deprivation data for Haringey?
(Good name Rae BTW.Arctic explorer - discovered last bit of the NW passage. Nice painting in the National Portrait Gallery - but then Art is another thing I likely don't understand).
-
Permalink Reply by John D on
-
Would that mean - " the unknown effect of the current increase in similarity of major cities " ?
If not, I have no idea what he is on about


-
-
Can you explain why you find it to be 'pointless rhetoric'?
I can see how the map is very relevant. I live in Bruce Grove ward.
I also understand what he is saying in the passage you 'pulled'. Where have you pulled this 'randsom piece of writing' from?
Isn't it unfair when you don't quote the source or the nature of the document?
And can YOU define 'psychobabble'.
-
Permalink Reply by Alan Stanton on
-
I haven't read Dr Rae. Nor have I had time to look properly at the Deprivation stats in Haringey. But it's vital that anyone concerned about inequality and poverty in Haringey and elsewhere, has a handle on these figures and what they mean in practice.
And that applies to everything. One good reason is that planning and budgeting need to be based on as solid a set of foundations as possible. Another reason is that the claim made by people - who should really know better - that the Council's so-called regeneration policies are working - as evidenced by the local area data in Northumberland Park ward.
I agree, Xavier that the quotation from Dr Rae is hardly the clearest and most beguiling invitation to his work. But maybe it gets better? And perhaps behind the jargon is some sharp observation and useful learning.
© 2026 Created by Hugh.
Powered by
![]()